
 >
>
 >
>
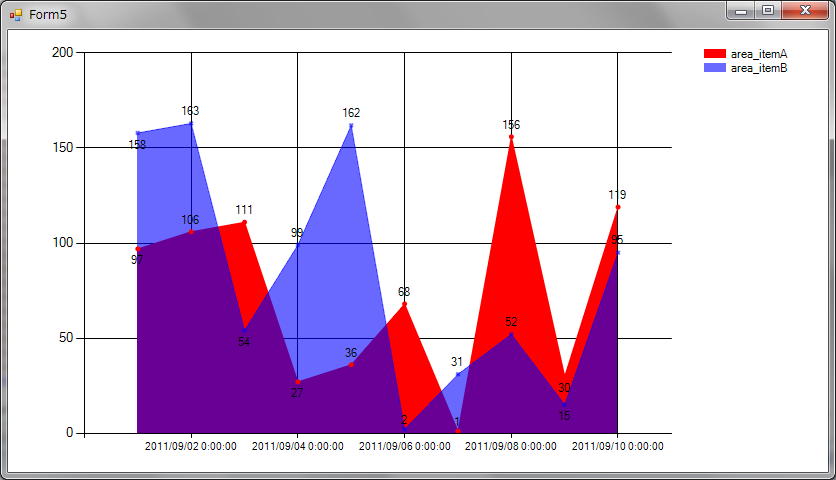
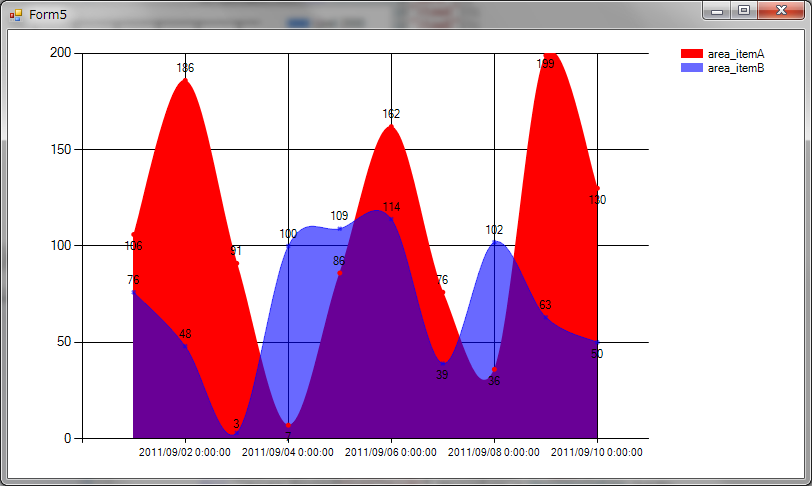
ここでは面グラフとスプライン面グラフの例を示しています。
        Chart _chart1 = new Chart();
        DataSet _ds = new DataSet();
        private void Form5_Load(object sender, EventArgs e)
        {
            DataTable dt = new DataTable();
            //日付用カラム
            dt.Columns.Add(new DataColumn("date"));
            //グラフA用のカラム
            dt.Columns.Add(new DataColumn("itemA"));
            //グラフB用のカラム
            dt.Columns.Add(new DataColumn("itemB"));

            Random rnd = new Random(DateTime.Now.Minute);
            for (int i = 1; i < 11; i++)
            {
                //新しい行を作成
                DataRow dr = dt.NewRow();
                dr["date"] = DateTime.Parse("2011/09/" + i.ToString("00"));
                dr["itemA"] = rnd.Next(200);
                dr["itemB"] = rnd.Next(200);
                dt.Rows.Add(dr);
            }
            this._ds.Tables.Add(dt);
            //チャートエリアを作成
            this._chart1.ChartAreas.Add("chartArea1");
            //グラフAを作成
            this._chart1.Series.Add("area_itemA");
            //グラフBを作成
            this._chart1.Series.Add("area_itemB");
            //凡例を作成
            this._chart1.Legends.Add("legend1");
            //マーカーを丸にする
            this._chart1.Series["area_itemA"].MarkerStyle = MarkerStyle.Circle;
            //グラフAの値を表示する
            this._chart1.Series["area_itemA"].IsValueShownAsLabel = true;
            //マーカーを十字にする
            this._chart1.Series["area_itemB"].MarkerStyle = MarkerStyle.Cross;
            //グラフBの値を表示する
            this._chart1.Series["area_itemB"].IsValueShownAsLabel = true;
            //両方のグラフをスプライン面にする
            this._chart1.Series["area_itemA"].ChartType = SeriesChartType.SplineArea;
            this._chart1.Series["area_itemB"].ChartType = SeriesChartType.SplineArea;
            //グラフAをチャートエリア1に設定する
            this._chart1.Series["area_itemA"].ChartArea = "chartArea1";
            //X軸を日付タイプにする
            this._chart1.Series["area_itemA"].XValueType = ChartValueType.Date;
            //X軸のデータを設定
            this._chart1.Series["area_itemA"].XValueMember = "date";
            //Y軸を整数型に設定
            this._chart1.Series["area_itemA"].YValueType = ChartValueType.Int32;
            //Y軸のデータを設定
            this._chart1.Series["area_itemA"].YValueMembers = "itemA";
            //グラフBをチャートエリア1に設定する
            this._chart1.Series["area_itemB"].ChartArea = "chartArea1";
            //X軸を日付タイプにする
            this._chart1.Series["area_itemB"].XValueType = ChartValueType.Date;
            //X軸のデータを設定
            this._chart1.Series["area_itemB"].XValueMember = "date";
            //Y軸を整数型に設定
            this._chart1.Series["area_itemB"].YValueType = ChartValueType.Int32;
            //Y軸のデータを設定
            this._chart1.Series["area_itemB"].YValueMembers = "itemB";
            //グラフAの色を赤に設定
            this._chart1.Series["area_itemA"].Color = Color.Red;
            //グラフBの色を半透明の青に設定
            this._chart1.Series["area_itemB"].Color = Color.FromArgb(150, Color.Blue);
            //データソースを設定
            this._chart1.DataSource = this._ds;
            this._chart1.DataBind();
            this.Controls.Add(this._chart1);
            this._chart1.Dock = DockStyle.Fill;
        }